Showing posts with label GRAPHICS. Show all posts

Wednesday, February 9, 2011

Lively City vs. Empty City

According to its transportation network (via # of trips):
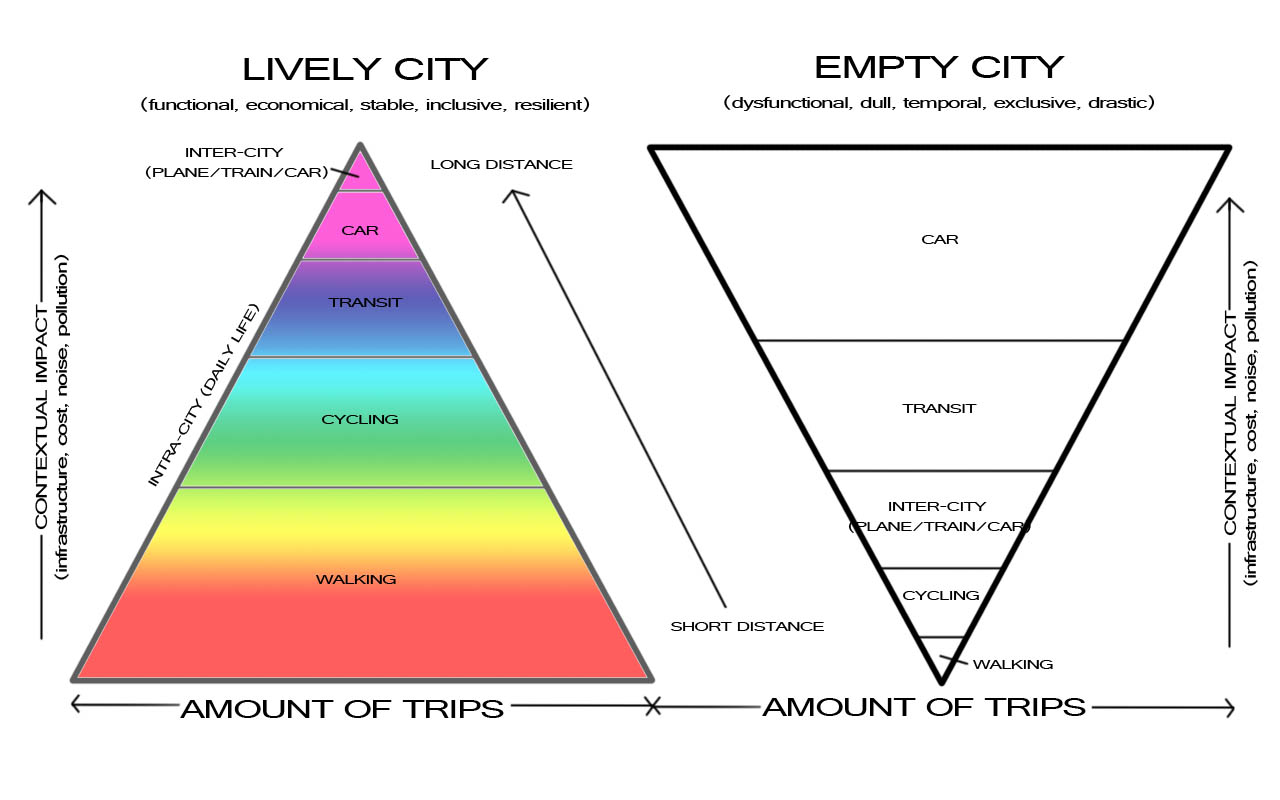

Click to embiggen.

Pay particular attention to the vertical y-axis, what I'm calling contextual impact. The transportation network has certain inputs and outputs, such as cost and infrastructure (input) as well as noise and pollution (output), which form a circular multiplier effect. These outputs reduce the quality of space, meaning reduced safety and desirability. The result is even less pedestrians. As a body politic we then turn and say, "well, there's no pedestrians and we have traffic, build more roads!"

We lose.

We lose:

Our wallets.

Our sanity.

Our quality of life.

Talent looking for a place to live and work.

Businesses looking for places for their employees to live.

Major events looking for a venue.

Monday, March 22, 2010

Squishing the Country

You know it is picking up steam when main stream political bloggers are discussing sprawl and urban planning now on a daily basis, particularly the common sense conservative ones. Andrew Sullivan links to more discussion of sprawl and its underlying causes. We know all of these already, but it is worthwhile to show the process of knowledge being internalized by the collective conscience. Here we see what the country might be like if it were the density of Brooklyn:

OneNeighborhood

It's a fun graphic, but ought to be rated intellectual NC-17. This is for adults only. No one is really going to make you move to Brooklyn or ewww, interact with others of different socio-economic status.